
SciDiagram
AI scientific diagram maker: describe a mechanism in one sentence, get an editable SVG
- Upvotes
- 0
- DR
- 3 +1 (up) since last check
- Followers
- 0
AI tool that generates scientific figures from text descriptions, producing editable SVG diagrams for research papers, posters and slides.
About SciDiagram
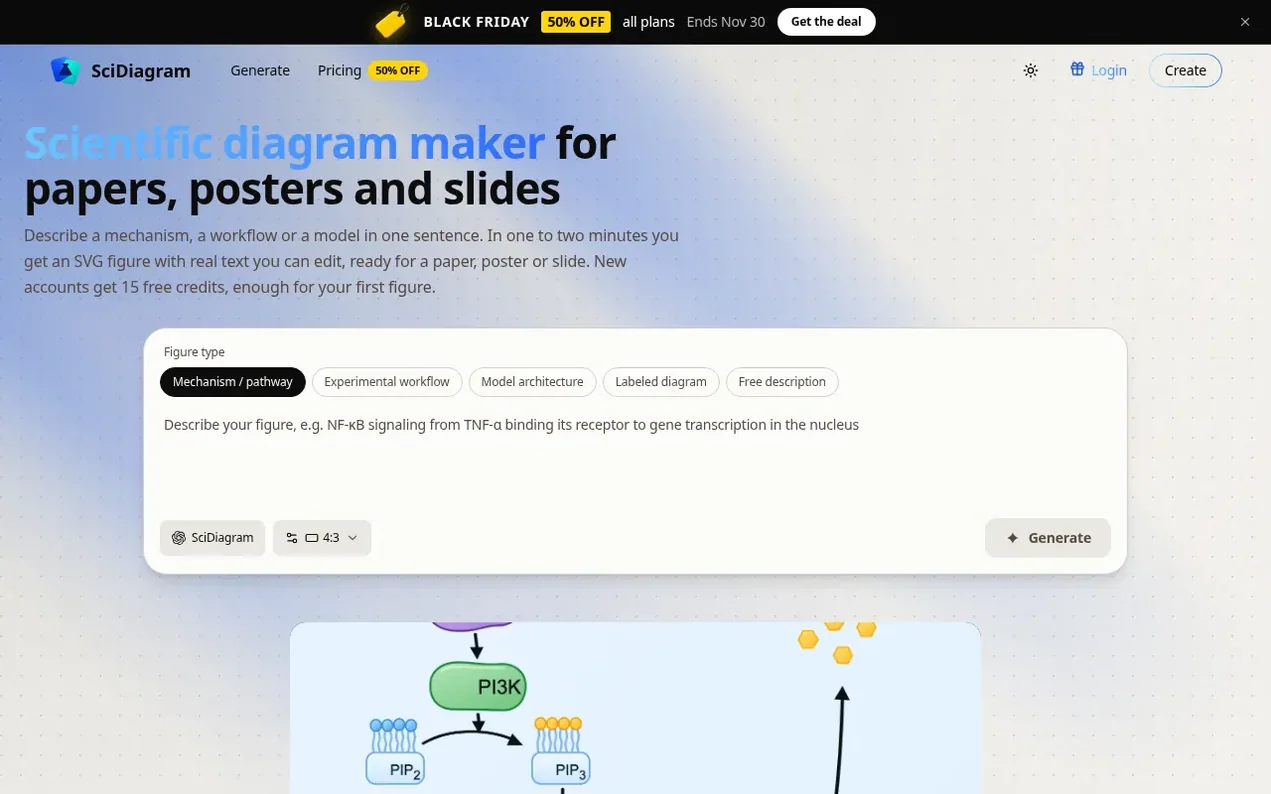
SciDiagram generates scientific figures from one-sentence descriptions. Users describe a mechanism, workflow, model architecture or labeled diagram, and the tool produces a complete SVG figure with real text labels in one to two minutes. The output can be edited in the browser to fix labels, change colours and fonts, and adjust layout. Downloaded SVGs open in Illustrator, Inkscape, Affinity Designer, Figma or PowerPoint for further editing. The platform also includes two free rule-based tools: a Punnett square generator and a PRISMA 2020 flow diagram generator. All generation, editing and downloading runs in the browser on desktop or mobile with no installation required.
- svg
- ai
- research
- academic
- scientific figures
- diagram generation
Features worth knowing
- Generate scientific diagrams from text descriptions in one to two minutes
- Export as editable SVG for Illustrator, Inkscape, Figma and PowerPoint
- Download as PNG at 2x or 4x resolution
- Automatic label fitting when figure opens in editor
- Free Punnett square generator
- Free PRISMA 2020 flow diagram generator
- Save figure versions to edit later
Pricing
Pricing model: Freemium
Free: 15 credits on sign-up (personal use only, watermarked PNGs). Basic: $19.90/month (Black Friday 50% off) or $178.80/year, 1,000 credits/month. Standard: $39.90/month (Black Friday 50% off) or $358.80/year, 2,500 credits/month. Pro: $99.90/month (Black Friday 50% off) or $838.80/year, 7,500 cred
Follow SciDiagram and hear about their milestones, new launches and demo videos by email. Stop any time.
SciDiagram metrics
| Metric | Value |
|---|---|
| Domain Rating | 3 +1 (up) since last check |
| Trust Flow | 4 no change since last check |
| Citation Flow | 14 no change since last check |
| Referring domains | 3 no change since last check |
| External backlinks | 11 no change since last check |
Ahrefs Domain Rating scanned 19 Nov 2026, updated 19 Nov 2026. Main topic: Computers/Software/Operating Systems (4). Majestic scanned 14 Nov 2026, updated 14 Nov 2026. Link stats via Majestic. Trust Flow, Citation Flow and Topical Trust Flow are trademarks of Majestic-12 Ltd.
SciDiagram domain facts
Reveal the domain facts
| Domain age | 10 days |
|---|---|
| Registered | |
| Expires | |
| Registrar | Spaceship, Inc. |
| DNSSEC | Not signed |
SciDiagram launch results
| Measure | At launch, then latest |
|---|---|
| Domain Rating (Ahrefs) | 2 to 2 no change since launch 14 Nov 2026, then 18 Nov 2026 |
| Trust Flow (Majestic) | 4 first measured 14 Nov 2026 |
| Referring domains (Majestic) | 3 first measured 14 Nov 2026 |
Day 5 since launch. Next receipt: day 30, 14 Dec 2026. The figures report a change; they do not say what caused it, and many things can. No figure here is a guess.
Launching something soon?
Free tips from Best Digital Launch for getting ready, launch day, the week after and what to do next.
- Set up
- On launch day
- The days after
- Beyond launch
Compare and explore
FAQ
- Can I use AI-generated figures in journal papers?
- Often yes for explanatory schematics, but publisher rules differ. Elsevier allows AI-made explanatory images like flow charts and schematics if you name the tool in the caption. Springer Nature accepts AI visuals derived from your own verifiable content. Always check your journal's guidelines and read every label before submitting.
- Are the labels scientifically accurate?
- Labels are not guaranteed accurate. The model draws them, so treat every figure as a first draft from someone knowledgeable but fallible. Read and verify every label against your own knowledge before use.
- What do I get when I download the SVG?
- An SVG file with labels as real text and shapes as paths and rectangles, not a wrapped image. You can open and edit it in Illustrator, Inkscape, Affinity Designer, Figma, PowerPoint, or any SVG editor, and scale it to any size.
- Is there a free plan?
- New accounts get 15 free credits, enough for one figure. Free-credit figures download as watermarked PNGs and are for personal use only. After that, paid plans remove the watermark and unlock SVG download.
- Which figure types does SciDiagram draw well?
- SciDiagram is best at schematics: signaling pathways and mechanisms, step-by-step lab workflows, model and system architectures, and textbook-style labeled diagrams. For data charts like bar graphs or scatter plots, use plotting software. For Punnett squares and PRISMA diagrams, use the free dedicated tools.
Leave a review for SciDiagram
Nobody has reviewed SciDiagram yet. Start things off.
A review is always free and can never be paid for. Go to the reviews and discussion
Reviews and chat · Product news · Send it on · Run this company? Claim it here · Report it
SciDiagram has a free listing. The owner can unlock the full profile with a paid launch for $5:
- Founder story (locked)
- Milestones (locked)
- Demo video (locked)
- Dofollow website link: not on this free listing (its website link is nofollow)
Alternatives to SciDiagram
Facy
Browser-based AI image and video editor for face swaps, head swaps, upscaling, and background removal
AI Media Generation10 votes. Log in to add your vote for FacyCicilili
AI music video generator for your songs
AI Media Generation3 votes. Log in to add your vote for CicililiSkryve
Turn videos into knowledge with visual AI analysis
AI Media Generation3 votes. Log in to add your vote for SkryveTurbogen
AI video and image studio with 28 models, pay per generation, no subscription
AI Media Generation1 votes. Log in to add your vote for Turbogen